기온과 임신 중 당뇨병과의 연관성 연구
Association between Temperature and Diabetes Mellitus in Pregnancy
Article information

Trans Abstract
Purpose
Exposure to heat and cold stress can negatively affect pregnant women. However, studies on the association between ambient temperature exposure and pregnant women, especially those with diabetes mellitus, are limited. The presence of this disease is likely to affect the woman's capacity to adapt to the demands of pregnancy, consequently affecting fetal development. We examined the association between exposure to the mean temperature and diabetes mellitus during pregnancy.
Methods
Health Insurance Reviews and Assessment Service was used to obtain data on patients hospitalized between January 2015 and August 2022. The association between the number of pregnant patients with diabetes mellitus according to monthly mean temperature and seasonal differences was analyzed using a generalized additive model. The model was adjusted for the treatment date, mean humidity, and mean age of the women.
Results
The total number of patients with diabetes mellitus in pregnancy was 651,655 and the mean temperature was 12.87℃±9.89℃. The association between the mean temperature and diabetes mellitus during pregnancy showed a U-shaped nonlinear association. During the entire period, the number of patients with diabetes mellitus in pregnancy significantly increased by 2.82 per 1℃ increase in mean temperature (estimate, 2.82; 95% confidence interval [CI], -2.06 to 7.71). The number of patients significantly increased by 72.12 per 1℃ increase in mean temperature in the summer (estimate, 72.12; 95% CI, 50.36–93.89), but the increase was not statistically significant in the winter.
Conclusion
Our findings suggest that maternal exposure to mean temperature during pregnancy is associated with diabetes mellitus.
서 론
기후 변화로 인해 임신부, 영아, 태아는 점점 더 취약한 대상으로 인식되고 있다(Roos et al., 2021; Rylander et al., 2013). 폭염으로 인해서 임신부가 열 스트레스에 노출되거나 극심한 한파에 노출될 경우, 조산, 저체중아(low birth weight) 및 선천성 기형(congenital anomalies) 등의 부정적인 임신 결과가 나타나며(Graham, 2020; Huang et al., 2021; Strand et al., 2011; Wang et al., 2020), 이는 국내 합계 출산율 0.78 (2022년 기준)인 저출산 시대에 출산의 질(quality of labor)이 중요시되는 상황에 큰 문제가 될 수 있다.
최근 연구에 따르면, 이러한 기후 변화가 임신부의 내분비질환 생성에도 영향을 미친다는 결과들이 발표되고 있다. 최근 연구에서 주변의 기온에 노출된 임신부를 대상으로 임신성 당뇨병(gestational diabetes mellitus, GDM)과의 연관성을 다룬 국외 연구들이 발표되고 있으며(Preston et al., 2020; Smith & Hardeman, 2020; Westphal et al., 2010), 국내에서도 국내 실정에 맞는 연구의 필요성이 높아지고 있다. 현재까지 국내에서 기온과 통계청 데이터를 이용한 부정적인 임신 결과(저체중아, 조산 등)에 대한 연관성 연구는 많았지만(Chersich et al., 2020; Kwag et al., 2021), 아직까지 기온과 임신부의 임신 중 당뇨병 간의 연관성을 다룬 국내 연구는 많지 않다.
이 연구에서는 서울, 경기 지역에 소재한 요양기관에 입원 또는 내원한 임신부들을 대상으로 평균 기온과 내분비계 질환인 임신 중 당뇨병 발생과의 연관성 분석을 하여, 이를 통해서 주변기온 노출에 따른 임신부 질환의 건강영향 기초 데이터를 구축하고자 한다.
대상 및 방법
1 데이터 수집
1) 기상자료
기상 데이터는 기상청 기상자료개방포털(Korea Meteorological Administration, 2023)의 기후 통계 분석에서 서울, 경기지역에 해당하는 월별 평균 기온, 평균 최저기온, 평균 최고기온 및 평균 습도의 정보를 수집하였다.
2) 결과 자료
이 연구 대상은 건강보험심사평가원(Health Insurance Review & Assessment Service, HIRA)에서 제공하는 ‘보건의료빅데이터 개방시스템 의료통계 정보(HIRA Bigdata Open Portal, 2023)’를 이용하여 정의하였다. 2015년 1월부터 2022년 8월까지 서울, 경기지역에 소재한 요양기관에 입원 또는 내원하여 주상병 코드가 임신 중 당뇨병(O24)에 해당하는 대상의 환자 수, 진료 연월 정보를 수집하였다. 제공되는 자료는 자료 조회 기준 시점(2022년 4월)에서 8개월 이전까지 제공되기 때문에 2022년 8월까지의 자료를 확보하였다. 건강보험심사평가원 자료에 따르면, 임신 중 당뇨병(O24)의 입원 · 외래별 비율(요양급여총액)의 경우, 외래 75.6%, 입원 24.4%로, 입원 대비 외래의 비율이 더 높았으며, 전체적인 임신부의 현황을 살펴보기 위하여 이 연구에서 연구 대상자로는 입원 및 내원 환자를 모두 포함하여 분석하였다.
건강보험심사평가원에서 제공하는 ‘보건의료빅데이터개방시스템 의료통계정보’ 데이터는 개별 데이터가 아닌 연도별, 입원 · 외래환자별, 지역별 임신부 질환자 수 및 요양급여를 나타낸 데이터로서 임신부 개인의 연령, 신장, 체중 등의 데이터를 얻을 수 없다. 따라서, 이 연구에서는 제한적으로 ‘천명당 조출생률’ 및 ‘모평균연령’ 변수를 통계청 국가통계포털(Korean Statistical Information Service, 2023)에서 수집하여 보정변수로 사용하였다.
2. 연구 방법 및 분석
이 연구는 이화여자대학교 의과대학부속 서울병원 기관생명윤리위원회(Institutional Review Board, IRB)에서 심사 면제 및 동의 면제를 승인을 받았다(IRB 승인번호: SEUMC 2022-10-046).
전국 인구의 50.5%가 수도권에 밀집되어 있어 인구 밀도가 높기 때문에 대표성 있는 지역으로 수도권(서울, 경기)을 연구대상 지역으로 고려하였다.
월별 환자 수 자료와 월별 기상자료를 연계하여 분석 자료를 구축하였다. 월별 평균 기온과 임신 중 당뇨병 연관성은 일반화 가법 모형(Generalized additive model, GAM)을 이용하여 분석하였다. 이 연구에서의 결과 변수는 ‘임신 중 당뇨병(O24) 환자 수’, 노출 변수는 ‘월별 평균 기온’이며, 보정 변수는 ‘진료 연월’, ‘월별 평균 습도’ 및 ‘모평균연령’을 이용하였다. 모형 평가는 각 모형의 Akaike Information Criterion (AIC) 값을 비교하여, 가장 낮은 값을 채택하였다. 또한, 평균 기온과 임신 중 당뇨병 간 노출-반응 관련성을 GAM 모형으로 시각화하였다. 자료 전처리 및 통계 분석은 R통계 소프트웨어(R version 4.2.2, R Foundation for Statistical Computing, Vienna, Austria)를 사용하여 분석하였다.
결 과
1. 임신 중 당뇨병 환자 수와 평균 기온
Table 1은 2015년 1월부터 2022년 8월까지의 연도별 임신 중 당뇨병(O24)의 국내 환자 수와 평균 기온, 평균 최저기온, 평균 최고기온을 나타낸 것이다. 각 연도별 기온의 평균과 표준편차의 값은 일 평균 기온, 최저기온(일 최저기온), 최고기온(일 최고기온)의 월 평균값으로부터 산출되었다. 연구 기간 동안 총 임신 중 당뇨병(O24) 환자 수는 651,655명이었으며, 평균 기온의 평균값은 12.87±9.89℃이었다. 임신 중 당뇨병(O24)의 환자 수는 2015년(93,158명)부터 2021년(82,792명)까지 점차 감소하는 추이를 보였다.
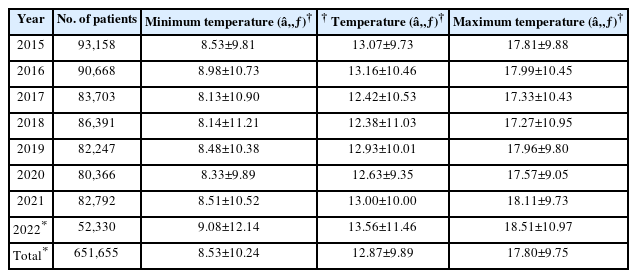
Number of patients with diabetes mellitus in pregnancy and mean temperatures (minimum, mean, maximum) by year
Fig. 1은 2015년 1월부터 2022년 8월까지의 월별 임신 중 당뇨병(O24)의 환자 수 및 평균 기온, 평균 최저기온, 평균 최고기온을 그래프로 나타낸 것이다. 월별 기온과 환자 수 그래프를 비교하였을 때, 2015년을 제외하고 전반적으로 하절기인 6-8월에 임신 중 당뇨병 환자 수가 해당연도 중 가장 높은 경향을 보였다.
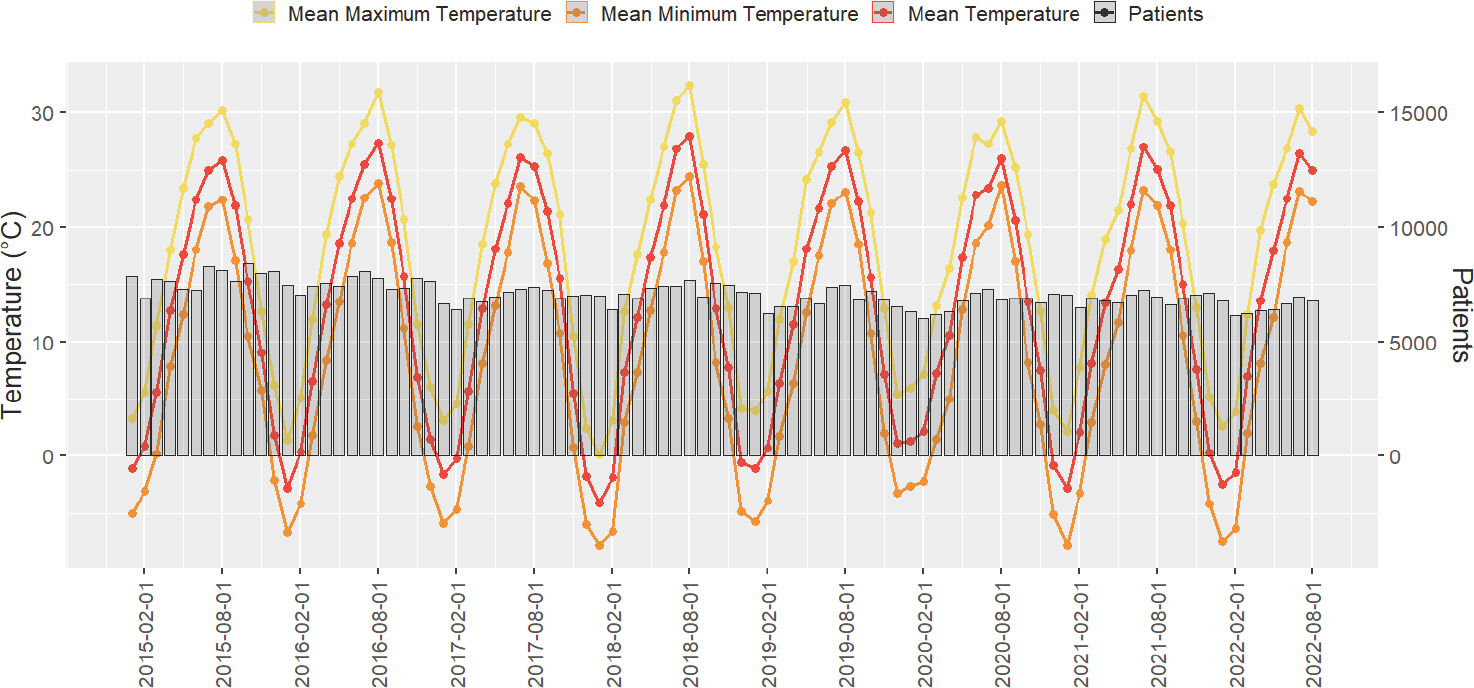
Number of patients with diabetes mellitus in pregnancy and mean temperatures (minimum, mean, maximum) by month.
2. 월별 평균 기온에 따른 임신 중 당뇨병 연관성 분석
Table 2는 월별 평균 기온에 대한 임신 중 당뇨병(O24) 환자 수를 일반화 가법 모형(GAM)을 이용하여 분석한 결과이다. Model 1 (unadjusted model)에서는 ‘평균 기온’만 분석하였고, Model 2에서는 시간 추이를 보정하기 위한 ‘진료 연월’을 추가 보정하였다. Model 3에서는 기온에 영향을 주는 ‘평균 습도’를, Model 4에서는 임신 중 당뇨병 환자 수에 영향을 주는 ‘모평균연령’을, 그리고 Model 5에서는 ‘천명당 조출생률’을 추가적으로 보정하여 모델을 구축하였다. 가장 적절한 모형을 찾기 위하여 각 모형을 평가하였을 때, Model 4에서 AIC 값이 가장 낮은 것으로 확인되어, 이 결과 분석에서는 Model 4를 채택하였다(Table 3). 전체 기간 동안(2015년 1월-2022년 8월)의 평균 기온에 따른 임신 중 당뇨병(O24) 환자 수를 Model 4로 분석하였을 때, 평균기온 1℃ 증가당 2.82명 증가하는 추세인 것을 확인하였으나, 이는 통계적으로 유의하지는 않았다(estimate, 2.82; 95% confidence interval [CI], -2.06 to 7.71).
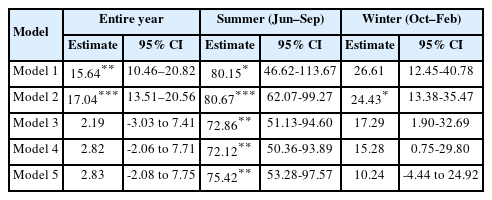
Analysis of adjusted and unadjusted generalized additive models of diabetes mellitus in pregnancy for mean temperature (2015–2022)
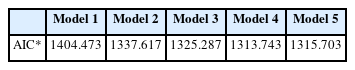
Comparison of Akaike Information Criterion (AIC) values
3. 월별 평균 기온에 따른 임신 중 당뇨병의 계절적 차이 분석 (전체, 하절기, 동절기)
계절적 평균 기온의 차이에 대한 세부 분석을 하기 위하여, 하절기는 6월에서 9월, 동절기는 10월에서 2월로 구분하였다. 하절기(6-9월)의 평균 기온에 따른 임신 중 당뇨병(O24) 환자 수를 Model 4로 분석하였을 때, 평균 기온 1℃ 증가당 72.12명으로 통계적으로 유의미하게 증가함을 확인하였다(estimate, 72.12; 95% CI, 50.36-93.89).
동절기(10-2월)의 평균 기온에 따른 임신 중 당뇨병(O24) 환자 수를 Model 4로 분석하였을 때, 평균 기온 1℃ 증가당 15.28명 증가하는 추세인 것을 확인하였으나, 통계적으로 유의하지는 않았다(estimate, 15.28; 95% CI, 0.75-29.80).
Fig. 2는 Model 4에 대한 노출-반응 관련성 그래프를 일반화 가법 모형(GAM)을 이용하여 도식화한 것이다.
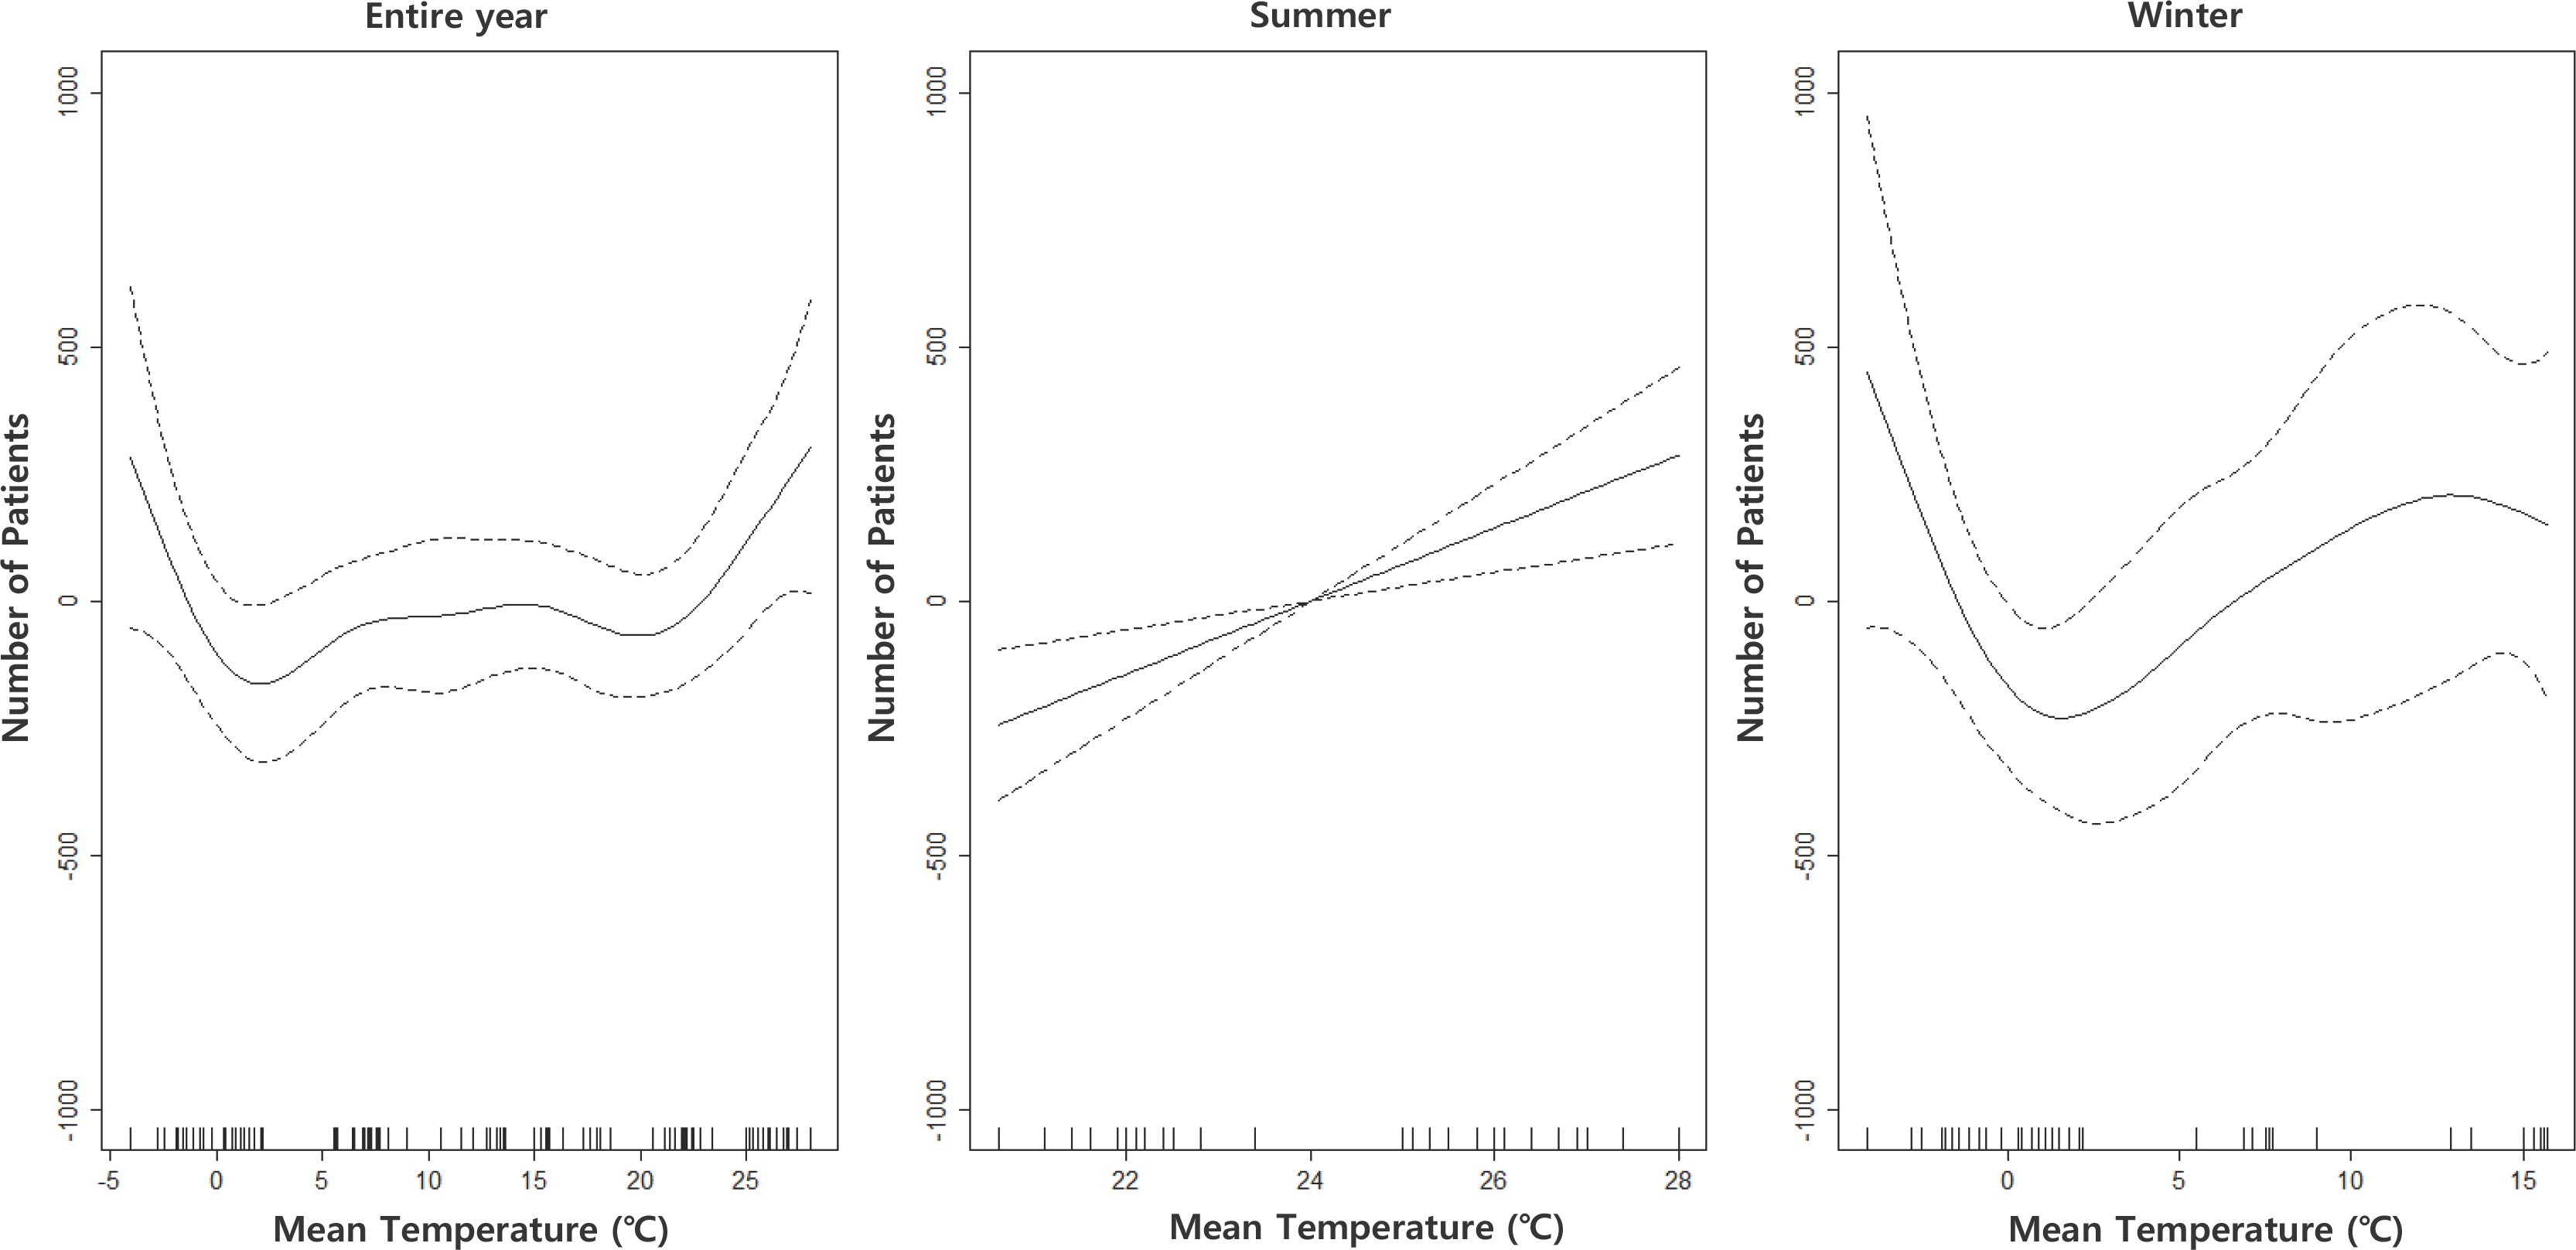
Generalized additive model plot of the number of patients with diabetes mellitus in pregnancy and mean temperature by season. All models were adjusted for the treatment date, mean humidity, and mean age of women.
전체 기간 동안의 평균 기온에 따른 GAM 분석을 한 결과, 특정 기온 이하 또는 이상에서 환자 수가 증가하는 U-자 모형의 비선형 연관성을 보였다. 이에 대한 세부 분석을 하기 위하여 하절기(6-9월)와 동절기(10-2월)를 나누어 분석한 결과, 하절기에는 선형적인 연관성을 보이며, 동절기에는 V-자 형태의 비선형 연관성을 보였다.
추이가 바뀌는 특정 기온을 찾기 위하여, 변곡점을 구한 결과, 전체 기간(2015년 1월-2022년 8월)에서는 -1.4℃ 이하에서 환자 수가 증가하는 추이를 보였고, 그 이상의 기온에서 완만한 형태를 보이다가, 23.4℃ 이상에서 다시 환자 수가 증가하는 것을 확인하였다. 또한, 동절기(10-2월) 분석에서 1.5℃를 기점으로 환자 수가 증가하는 형태를 보였다.
고 찰
이 연구는 서울과 경기지역에서 2015년부터 2022년까지의 월별 평균 기온과 임신 중 당뇨병과의 연관성을 분석하였다. 이 연구자료에서 임신 중 당뇨병(O24) 환자 수는 2015년부터 2021년까지 꾸준히 감소함을 보였다. 이러한 결과는, 해마다 낮아지는 출산율 및 고령 산모 증가가 임신 중 당뇨병(O24) 환자 수에 영향을 미쳤을 것으로 예상할 수 있다. 전체 연구 기간 동안, 월별 평균 기온 증가와 임신 중 당뇨병 연관성은 관찰되지 않았지만, 하절기(6-9월)에는 평균 기온 1℃ 증가당 임신 중 당뇨병 환자 수가 증가하는 것을 관찰하였다(estimate, 72.12; 95% CI, 50.36-93.89).
1. 월별 평균 기온과 임신 중 당뇨병의 연관성
전체 기간 동안의 월별 평균 기온에 따른 환자 수의 연관성을 GAM 분석하여 노출-반응 관련성을 보았을 때, 그래프가 비선형성을 나타내며, 양극단의 기온으로 갈수록 환자 수가 증가하는 U-자형 형태를 이루는 것을 확인하였다. 또한, U-자형 형태에서 특정 기온(−1.4℃ 이하 및 23.4℃ 이상)을 기점으로 환자 수가 증가하는 형태를 보였다. 이전의 기온과 건강영향 연구에서 또한 연관성은 주로 U, V, J의 ‘비선형성’ 형태로 나타나는 것을 보고하였으며(Kim et al., 2006; Kim, 1999), 이러한 U-자형 결과는, 제2형 당뇨병과 기온과의 연관성 연구 결과에서도 보고된 바 있다(Luo et al., 2021).
이러한 U-자형 형태를 상세화하기 위하여 이 연구에서는 계절을 나누어 세부 분석하였다. 계절적 차이에 대한 환자 수와 기온에 대한 영향을 평가하기 위하여, 2015년 1월부터 2022년 8월까지의 전체 월별 자료를 하절기(6-9월)와 동절기(10-2월)로 나누어 세부 분석하였다. 하절기를 6-9월로 한정한 이유는 주로 폭염이 집중되는 7월과 8월을 포함하고자 함이며, 초여름과 늦여름을 포함하고자 6월과 9월을 포함하였다. 또한, 동절기는 이전의 계절 관련 연구에서 동절기에 해당하는 기간을 다양하게 분석한 것을 확인하였고, 일부 연구에서 가을과 겨울을 통합하여 9-2월로 지정하거나 10-3월 등으로 지정한 것을 확인하였다. 이에, 이 연구에서는 초겨울에 해당하는 10월부터 늦은 겨울에 해당하는 2월을 동절기로 포함하였다(Part et al., 2022; Tsujimoto et al., 2014).
2. 하절기 평균 기온과 임신 중 당뇨병과의 연관성
하절기에는 전체 기간 및 동절기와 달리 평균 기온에서 뚜렷한 선형성을 나타냈으며, 모든 모형(Model 1∼Model 5)에서 통계적으로 유의하였다. 이는 기온이 상승하는 하절기 및 고온의 환경에서 임신 중 당뇨병 발생과의 연관성이 큰 것을 나타낸다. 고온 및 하절기에서 임신 중 당뇨병 발생이 뚜렷하게 증가하는 경향은, 이전의 단기 노출 연구 및 체계적 문헌고찰 연구에서도 동일하게 밝혀진 바 있다(Moses et al., 2016; Preston et al., 2020). 해당 연구에 따르면, 임신성 당뇨병의 경우 주변기온 또는 계절적 변화에 영향을 받으며, 여름의 임신성 당뇨병(GDM)의 유병률이 전체 연도 유병률과 대비하여 28% 이상 높았으며(Moses et al., 2016), 높은 주변기온과 높은 임신 혈당 수치(glucose level)의 연관성을 보고하였다(Preston et al., 2020). 또한, 일반 성인 당뇨병과 열 스트레스와의 연관성을 다룬 한 연구에서 당뇨병 환자는 당뇨병이 없는 사람보다 열로 인한 부작용(예를 들어, 응급실 방문 및 입원 횟수 증가, 탈수 및 전해질 이상 발생 증가, 사망률 증가)에 더 취약할 수 있음을 보고하였고(Westphal et al., 2010), 체액 및 전해질 교란으로 인한 혈당조절 장애(Faunt et al., 1995) 및 포도당 항상성 조절(Møller et al., 1989) 문제 등이 요인이 될 수 있음을 보고하였다.
현재까지 임신 중 당뇨병과 고온 노출에 대한 명확한 생리학적 기전은 보고된 바 없지만, 고온의 환경에서는 당이 높은 과일, 아이스크림 및 청량 음료 등을 많이 섭취하며(Prasad et al., 2010), 실외기온이 높은 경우 신체 활동량이 감소하는 것으로 보고하여(Tucker & Gilliland, 2007), 이러한 고온 노출에 따른 음식 소비 및 신체활동 등의 생활방식 요인이 임신 중 당뇨병의 증가 경향을 설명할 수 있음을 보고하였다(Laine et al., 2020).
3. 동절기 평균 기온과 임신 중 당뇨병과의 연관성
동절기를 세부 분석하였을 때 통계적으로 유의하지 않아, 저온 노출에서의 임신 중 당뇨병 발생과의 연관성은 일관성이 없는 것으로 확인하였다. 이전의 저온 노출과 임신성 당뇨병 연관성 관련 연구에 따르면, 기온이 10℃ 증가할 때마다 임신성 당뇨병 위험이 상대적으로 6%-9% 증가하는 것으로 보고하였으며(Booth et al., 2017), 다른 연구에서는 유병률은 전체 유병률보다 여름에 29% 높았고 겨울에 27% 낮은 것으로 보고하여(Moses et al., 2016), 고온에 비하여 저온과의 연관성이 낮은 연구 결과가 많았다.
하지만, 이 연구의 노출-반응 관련성 그래프에서는 -1.4℃ 이하에서 환자 수가 증가하는 연관성을 보였고, 이전까지의 연구 결과와 다른 결과이므로, 저온에 대한 연관성 분석이 추가적으로 필요할 것으로 보인다.
전체 임신의 약 3%-10%는 임신 중 당뇨병으로 알려져 있으며, 임신 중 당뇨는 세부적으로는 임신 전 당뇨병과 임신성 당뇨병으로 구분된다. 임신성 당뇨는 전체 임신중 당뇨의 약 90%를 차지하는 것으로 알려져 있으며, 임신 전 당뇨병은 상대적으로 빈도가 적은 편이다(Kim, 2018). 임신 전 당뇨병에 해당하는 상병코드는 O24.0-O24.3에 해당하며, 임신성 당뇨병은 O24.4, O24.9에 해당한다(Kang et al., 2010). 건강보험심사평가원 보건의료빅데이터 개방시스템 의료통계정보에서 조회되는 자료는 3단상병, 4단상병으로 식별되지만 여러 코드를 포괄적으로 식별할 수 없기 때문에 이 연구에서는 임신 중 당뇨병(O24)을 이용하였다. 임신 전 당뇨병은 임신 전에 발생하는 제1형 및 제2형 당뇨병을 모두 포함하는 반면, 임신성 당뇨병은 일반적으로 인간 태반 락토겐 및 종양괴사인자 알파와 같은 인자로 인한 임신 중 인슐린 저항성에 기반하고 있다(Fong et al., 2014). 또한, 이 연구에서 임신 전 당뇨병(O24.0-O24.3)의 대상자로는 가임기 여성이나 임신부가 아닌 여성도 포함될 수 있으므로, 임신의 여부가 임신 중 당뇨병과 기온의 연관성에 영향을 미친다는 것을 보기 위해서는 임신 전과 임신성 당뇨병을 명확히 구분한 연구가 수행될 필요가 있다.
이 연구는 2015년 1월부터 2022년 8월까지의 임신부를 대상으로 연구하였으므로, 2020년 이후 국내에 발생한 코로나의 영향을 배제할 수 없다. 연구 기간 중 코로나 기간이 포함되어 있기 때문에, 향후 연구에서는 코로나 기간을 고려한 연구가 필요하다. 또한, 계절별 영향을 분석하기 위하여 이 연구에서는 하절기를 6-9월, 동절기를 10-2월로 나누어 분석하였으나, 월별 데이터를 다른 월별 데이터로 구성하여 분석한다면, 이 연구 결과와 다를 수 있다.
이 연구는 건강보험심사평가원에 보고되어 있는 서울, 경기지역에 소재한 요양기관에 입원 및 내원한 임신부만을 대상으로 하므로, 전국에 대한 데이터는 아니며, 임신부 각각의 개별 자료가 아닌, 건수 중심의 자료이기 때문에, 임신부의 수가 일부 중복될 수 있고, 산과적(임신 주수, 조산 이력 등), 사회 인구학적(임신부의 사회 경제적 지위, 체질량지수, 담배 또는 알코올 소비), 그리고 임상적(혈압, 혈당 등의 검진자료) 특징과 같은 개별 변수의 확인 및 조정이 어려워 기온과 질환 발생의 연관성을 추정하는 데 잠재적 편향의 가능성이 있으며, 증감 추세의 변화 또는 원인을 정확하게 판단할 수 없었다. 또한, 이 연구에서 사용한 자료는 개별자료가 아닌 인구 집계된 건수 자료로서, 질병에 대한 정확한 정보(진단의 정확성 및 질병의 발생과 종료)를 파악할 수 없으며, 연구 대상자 개개인의 주민등록 주소지, 생활 근거지 등을 알 수 없다. 개개인의 상세한 노출정도(노출 측정 지점으로부터 주민등록 주소지까지의 거리, 측정 간격, 측정 빈도 등) 등을 파악할 수 없기 때문에, 노출 할당의 부정확성이 있을 수 있다. 이러한 점은 추후 전국적인 데이터를 구축하여 연구할 필요가 있을 것으로 보인다.
결 론
이 연구를 통하여, 평균 기온과 임신 중 당뇨병의 비선형성의 연관성을 확인할 수 있었다. 양극단의 기온으로 갈수록 환자 수 증가 추이가 보여, 현재까지 임신성 당뇨병과 연관성이 많이 발표된 고온뿐만 아니라, 저온에서의 추가적인 연구의 수행이 필요하다. 향후 연구에서는 개인 단위의 자료를 이용하여 인과적 연관성에 가까운 연구 디자인의 수행이 필요하다.
Notes
저자들은 이 논문과 관련하여 이해관계의 충돌이 없음을 명시합니다.
감사의 글 및 알림(ACKNOWLEDGMENTS)
이 연구는 2022년도 정부(과학기술정보통신부)의 재원으로 한국연구재단의 지원을 받아 수행된 연구입니다(No. 2022R1 A6A3A01085789).
이 연구는 이화-SCL 환경건강 연구센터의 연구지원을 받아 수행되었습니다(No. 1-2022-0205-001-2).